
Tale of the Tape: Ohio State vs. Michigan
The Battle for Commercial Real Estate Bragging Rights
It's that time of year again. Scarlet and gray versus maize and blue. Buckeyes versus Wolverines. It's one of college football's most anticipated matchups.
The rivalry is legendary. The bragging rights are priceless. And while the debate over football supremacy rages on, we've got another question worth settling: Who's winning in commercial real estate?
We're trading touchdowns for total inventory, yardage for square footage and the scoreboard for market statistics.
Of course, the Columbus metropolitan area has a size advantage, so we're leveling the playing field. Our matchup examines commercial real estate within a two-mile radius of each university's student union, giving both markets the same turf to defend.
The stats are in, the matchup is set and bragging rights are on the line.
Welcome to the inaugural Tale of the Tape: Ohio State vs. Michigan.
__________________________________
The Matchup: Student Union & Main Campus
The Analysis: Both universities bring some serious size, but they've built their rosters differently. Ohio State leads in the number of campus buildings and has a clear edge in on-campus housing, with 41 residence halls and 14,750 beds compared to Michigan's 23 halls and 11,800 beds. The Buckeyes also claim the bigger student union, with 68,000 more square feet to work with.
Michigan, meanwhile, makes up ground with a more expansive campus footprint, boasting 3,188 acres and 38.6 million square feet of buildings. And when it comes to packing the stands, the Big House edges out the Horseshoe by nearly 5,000 seats.
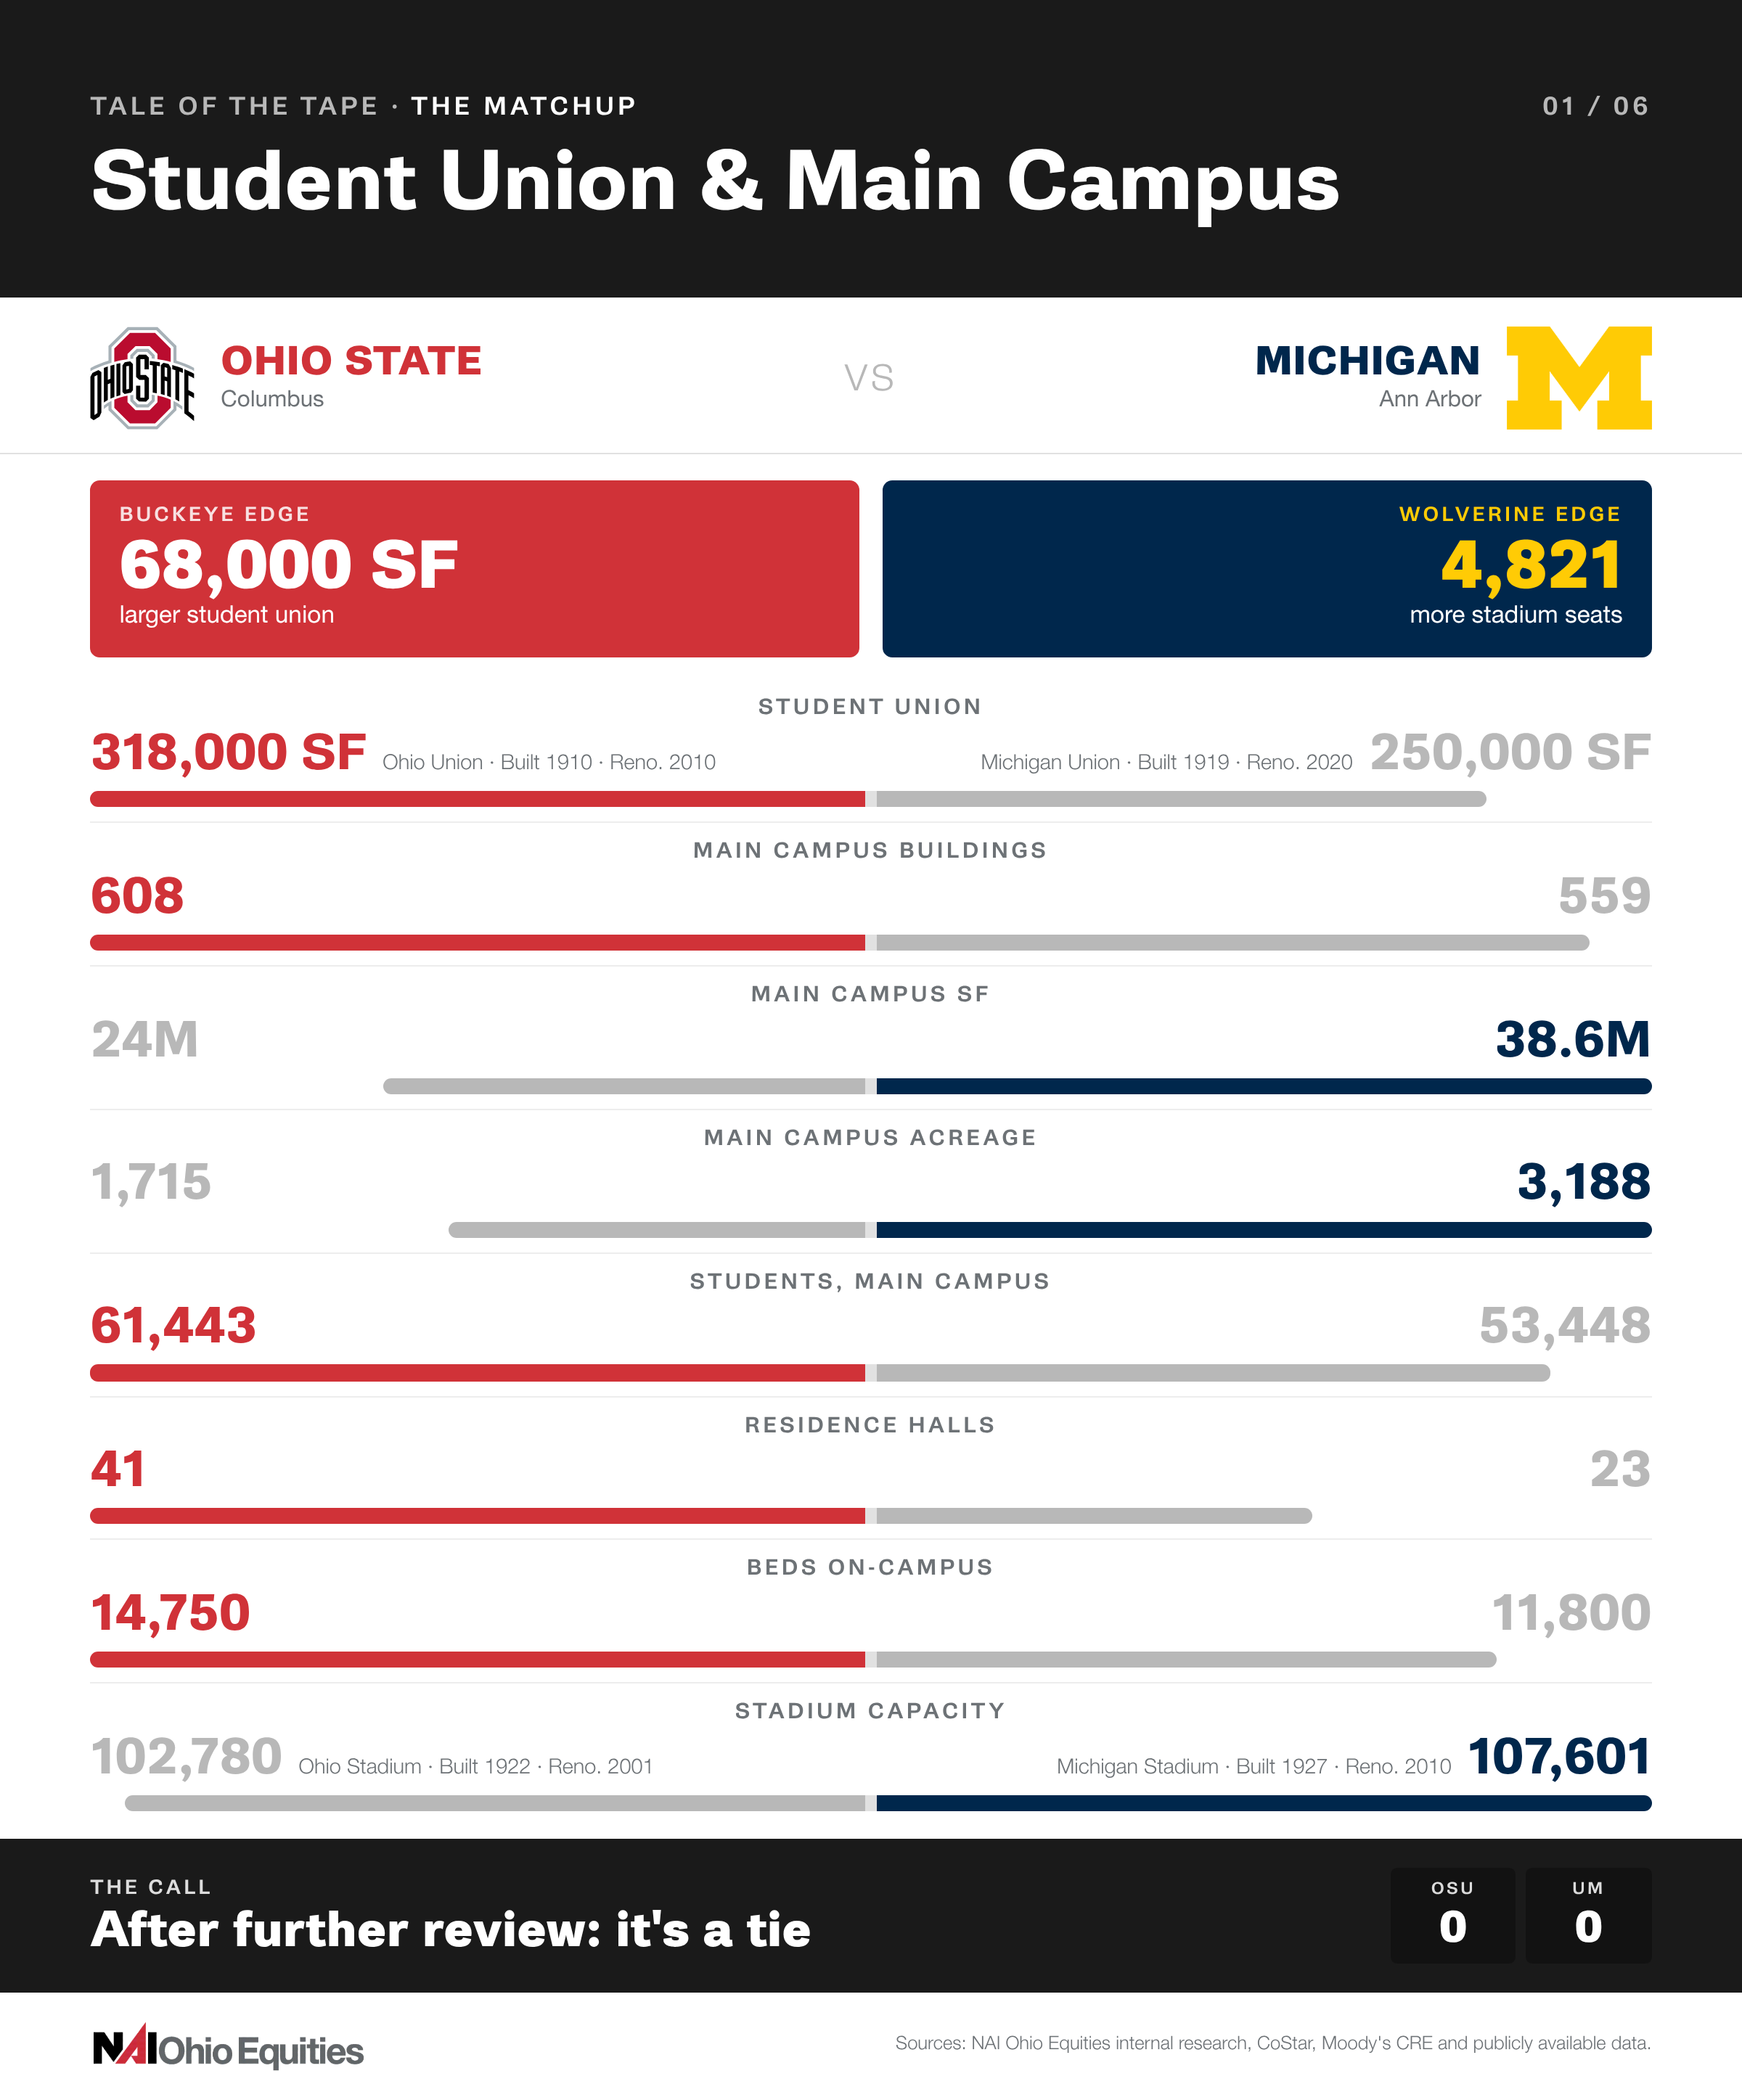
The Call: We're going to the replay booth! Ohio State takes student union size and on-campus housing, while Michigan counters with more campus acreage, square footage and stadium seats. After further review, the call on the field stands. It's a tie.
__________________________________
The Matchup: Total Commercial Buildings
The Analysis: Ohio State comes out swinging with 1,282 commercial buildings (office, industrial/flex, and retail) and 21.7 million square feet, compared to Michigan's 832 buildings and 7.9 million square feet. The Buckeyes also hold the defensive line with a lower vacancy rate of 3.5% compared to the Wolverines' 5.2%. Michigan counters with higher rental rates and sale prices, but when it comes to sheer size and occupancy, Ohio State is controlling the field.
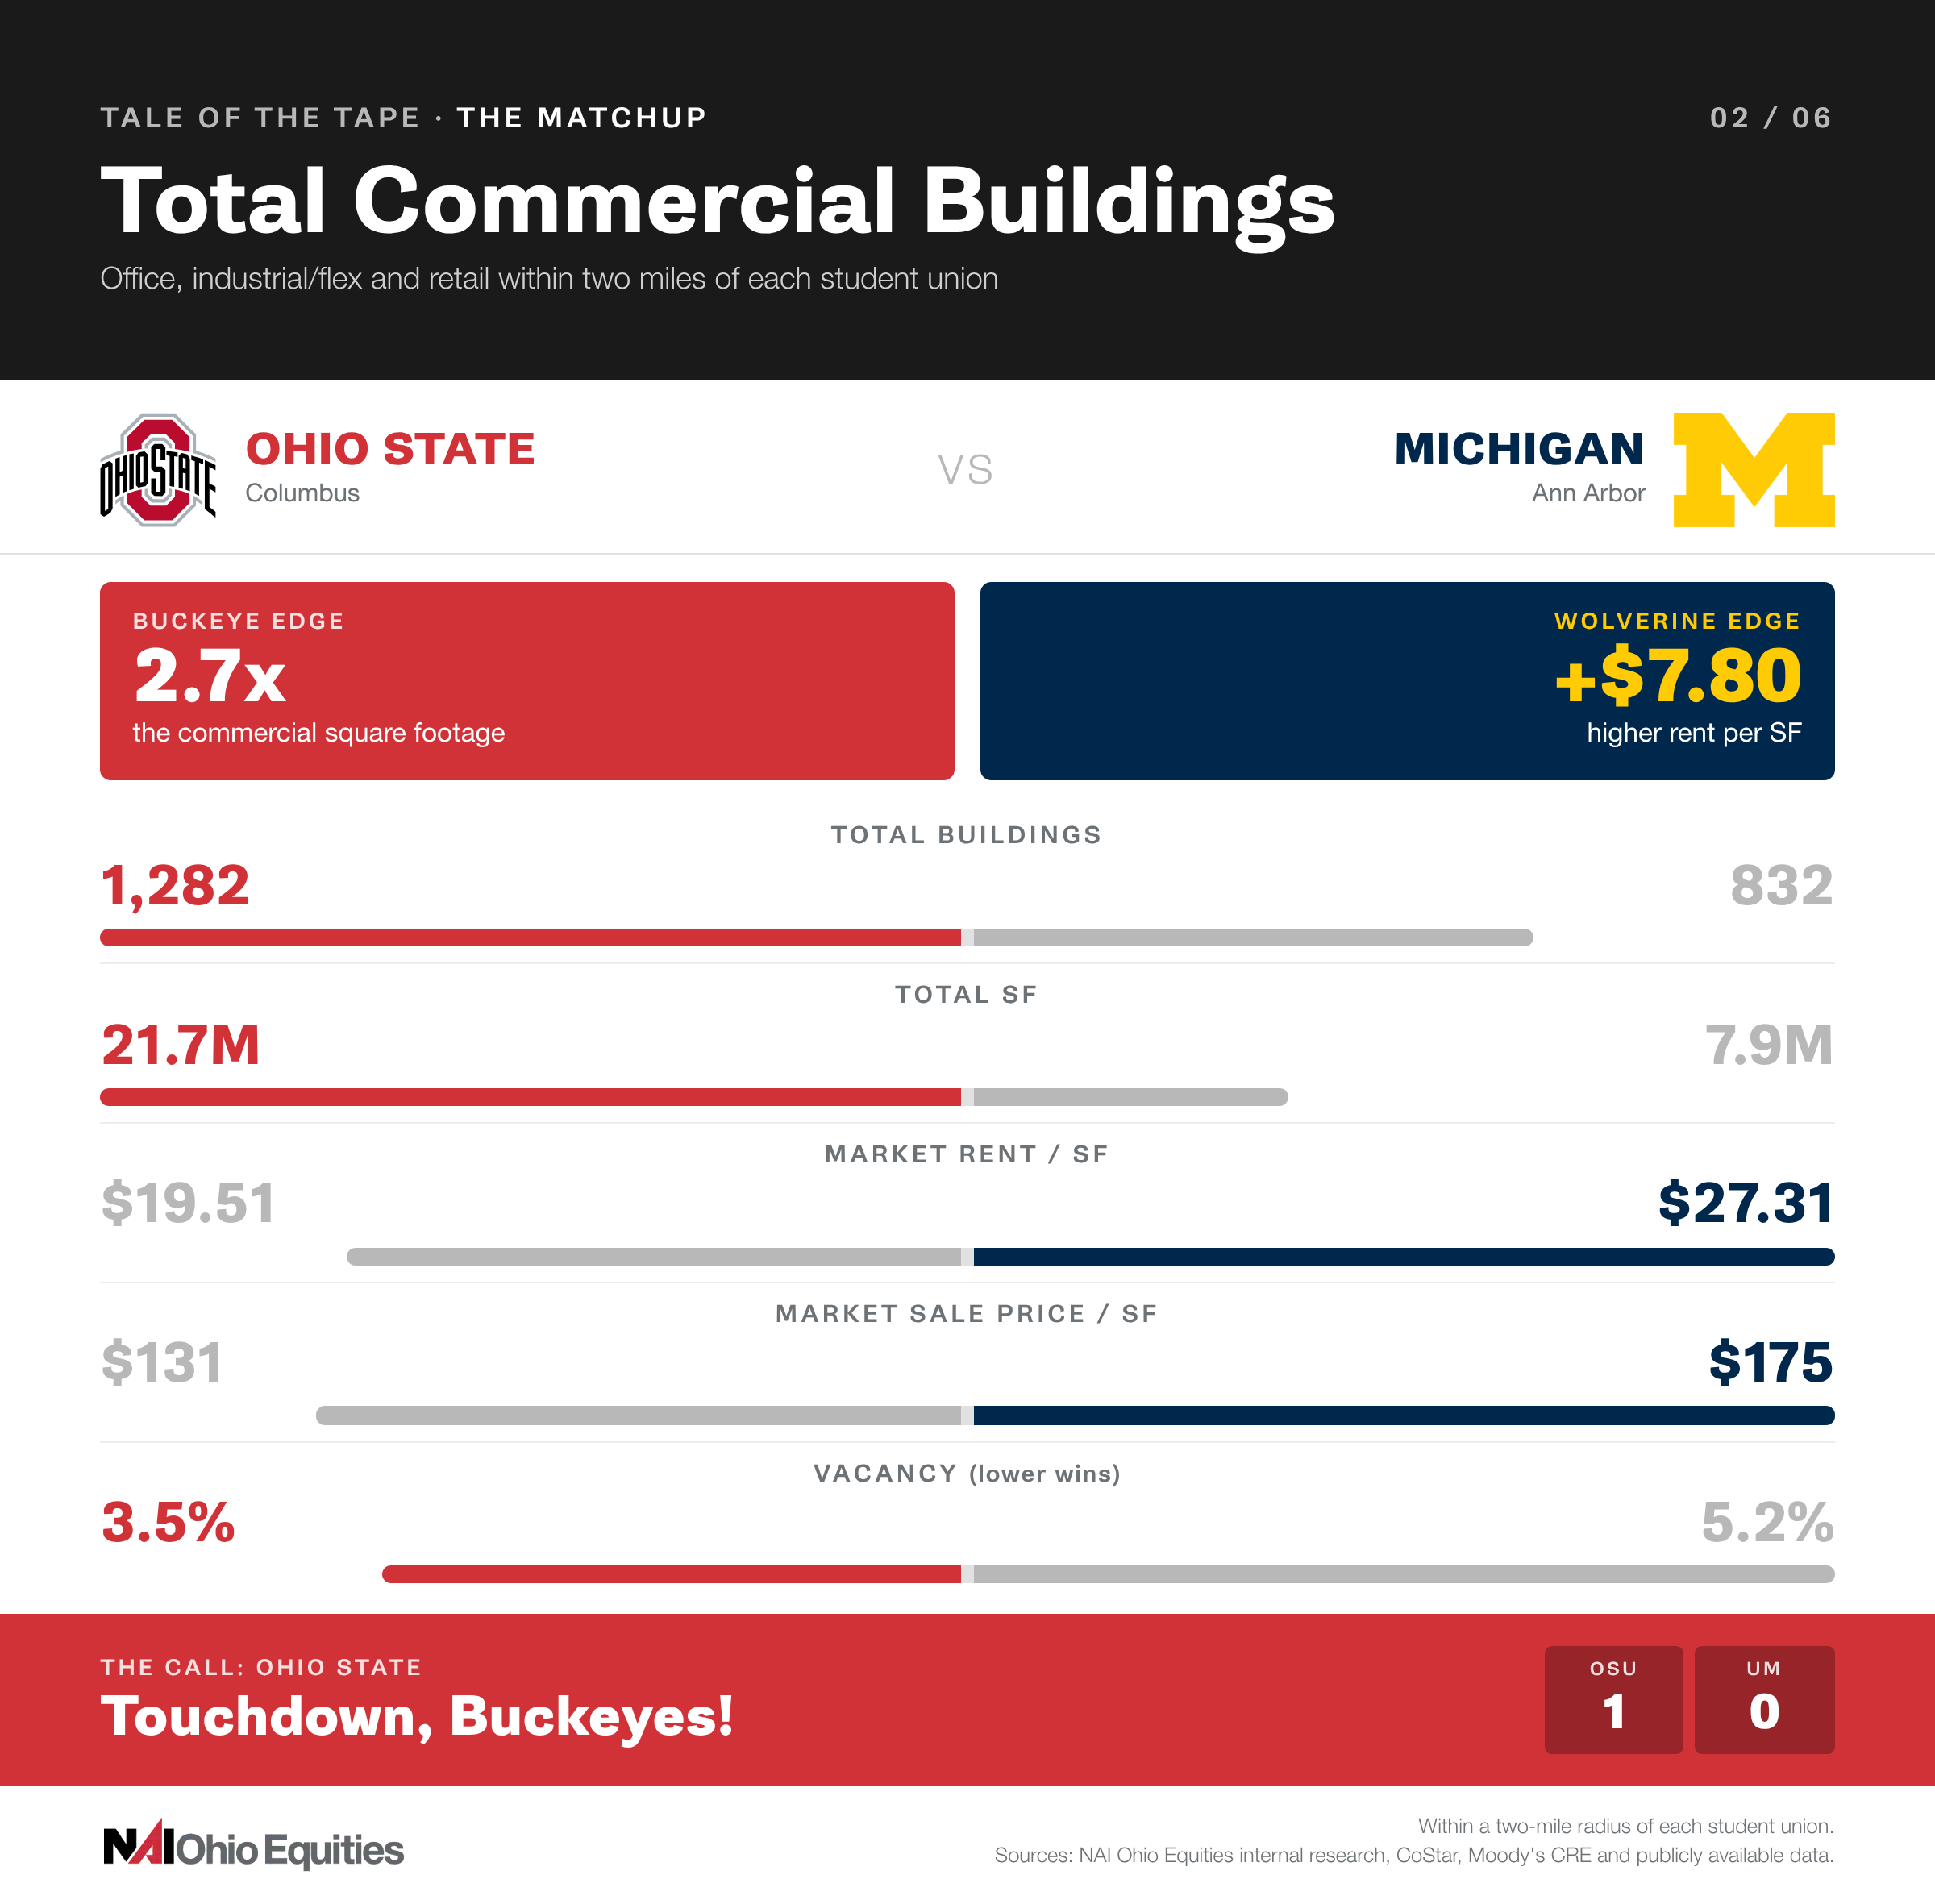
The Call: Touchdown, Buckeyes! Ohio State takes this one with nearly three times the commercial square footage and lower vacancy. Columbus benefits from the scale of a major metropolitan market, while Ann Arbor brings the character of a college town. Looks like the Wolverines could use a bigger playbook.
__________________________________
The Matchup: Office
The Analysis: Michigan makes its case with 301 office buildings compared to Ohio State's 264, along with higher rental rates and a prime location just one mile from downtown Ann Arbor. That proximity to the city's central business district gives the Wolverines a geographic advantage, bringing campus and commercial activity closer together.
Ohio State counters with more than twice the office square footage, 8.1 million compared to Michigan's 3.8 million, and a slightly lower vacancy rate of 7.1% versus 7.8%. But while the Buckeyes bring the size, Michigan's downtown connectivity and higher rents give the Wolverines an edge in this round.
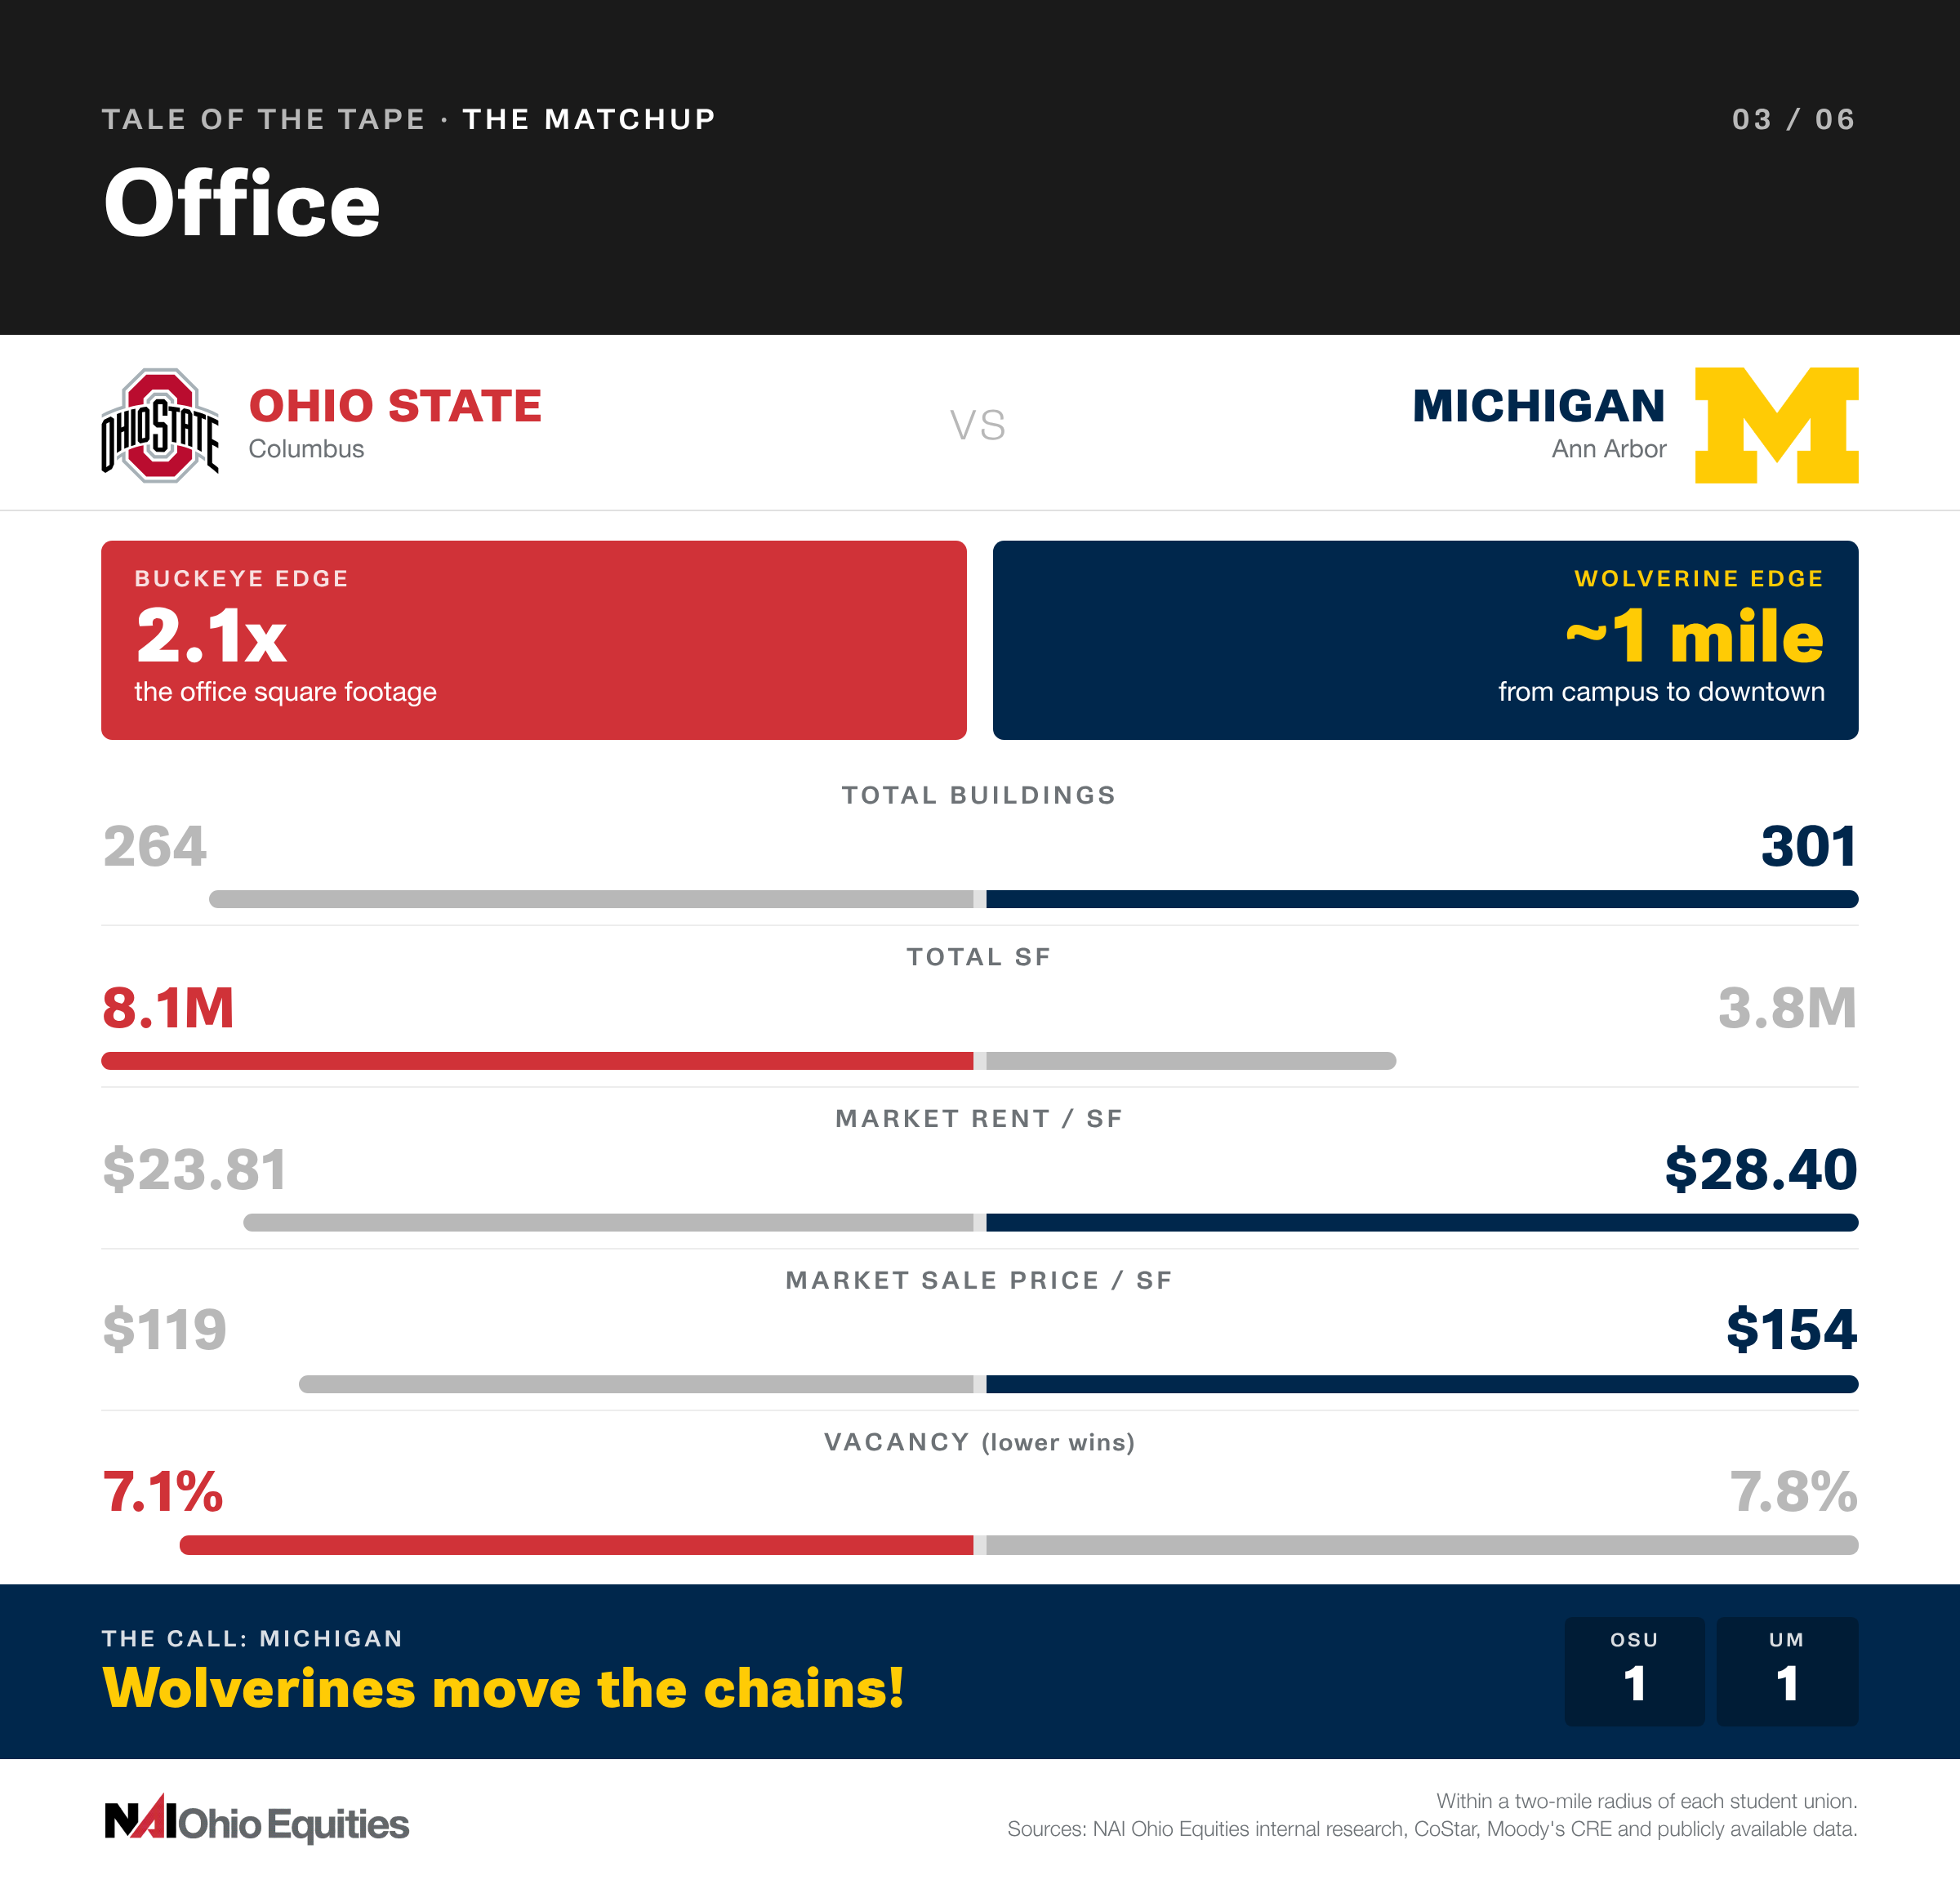
The Call: Wolverines moves the chains! Ohio State leads in square footage and occupancy, but Michigan has a location advantage. Ann Arbor's central business district is about a mile from campus, bringing downtown office activity closer to the university, while downtown Columbus sits more than two miles from Ohio State. The Wolverines pick up the points.
__________________________________
The Matchup: Industrial/Flex
The Analysis: The Buckeyes aren't just winning this matchup; they're running up the score! Ohio State brings 367 industrial and flex buildings and 9 million square feet to the field, compared to Michigan's 82 buildings and 1.2 million square feet. Throw in a vacancy rate of just 1.3% versus Michigan's 3.7%, and this one is looking like a blowout.
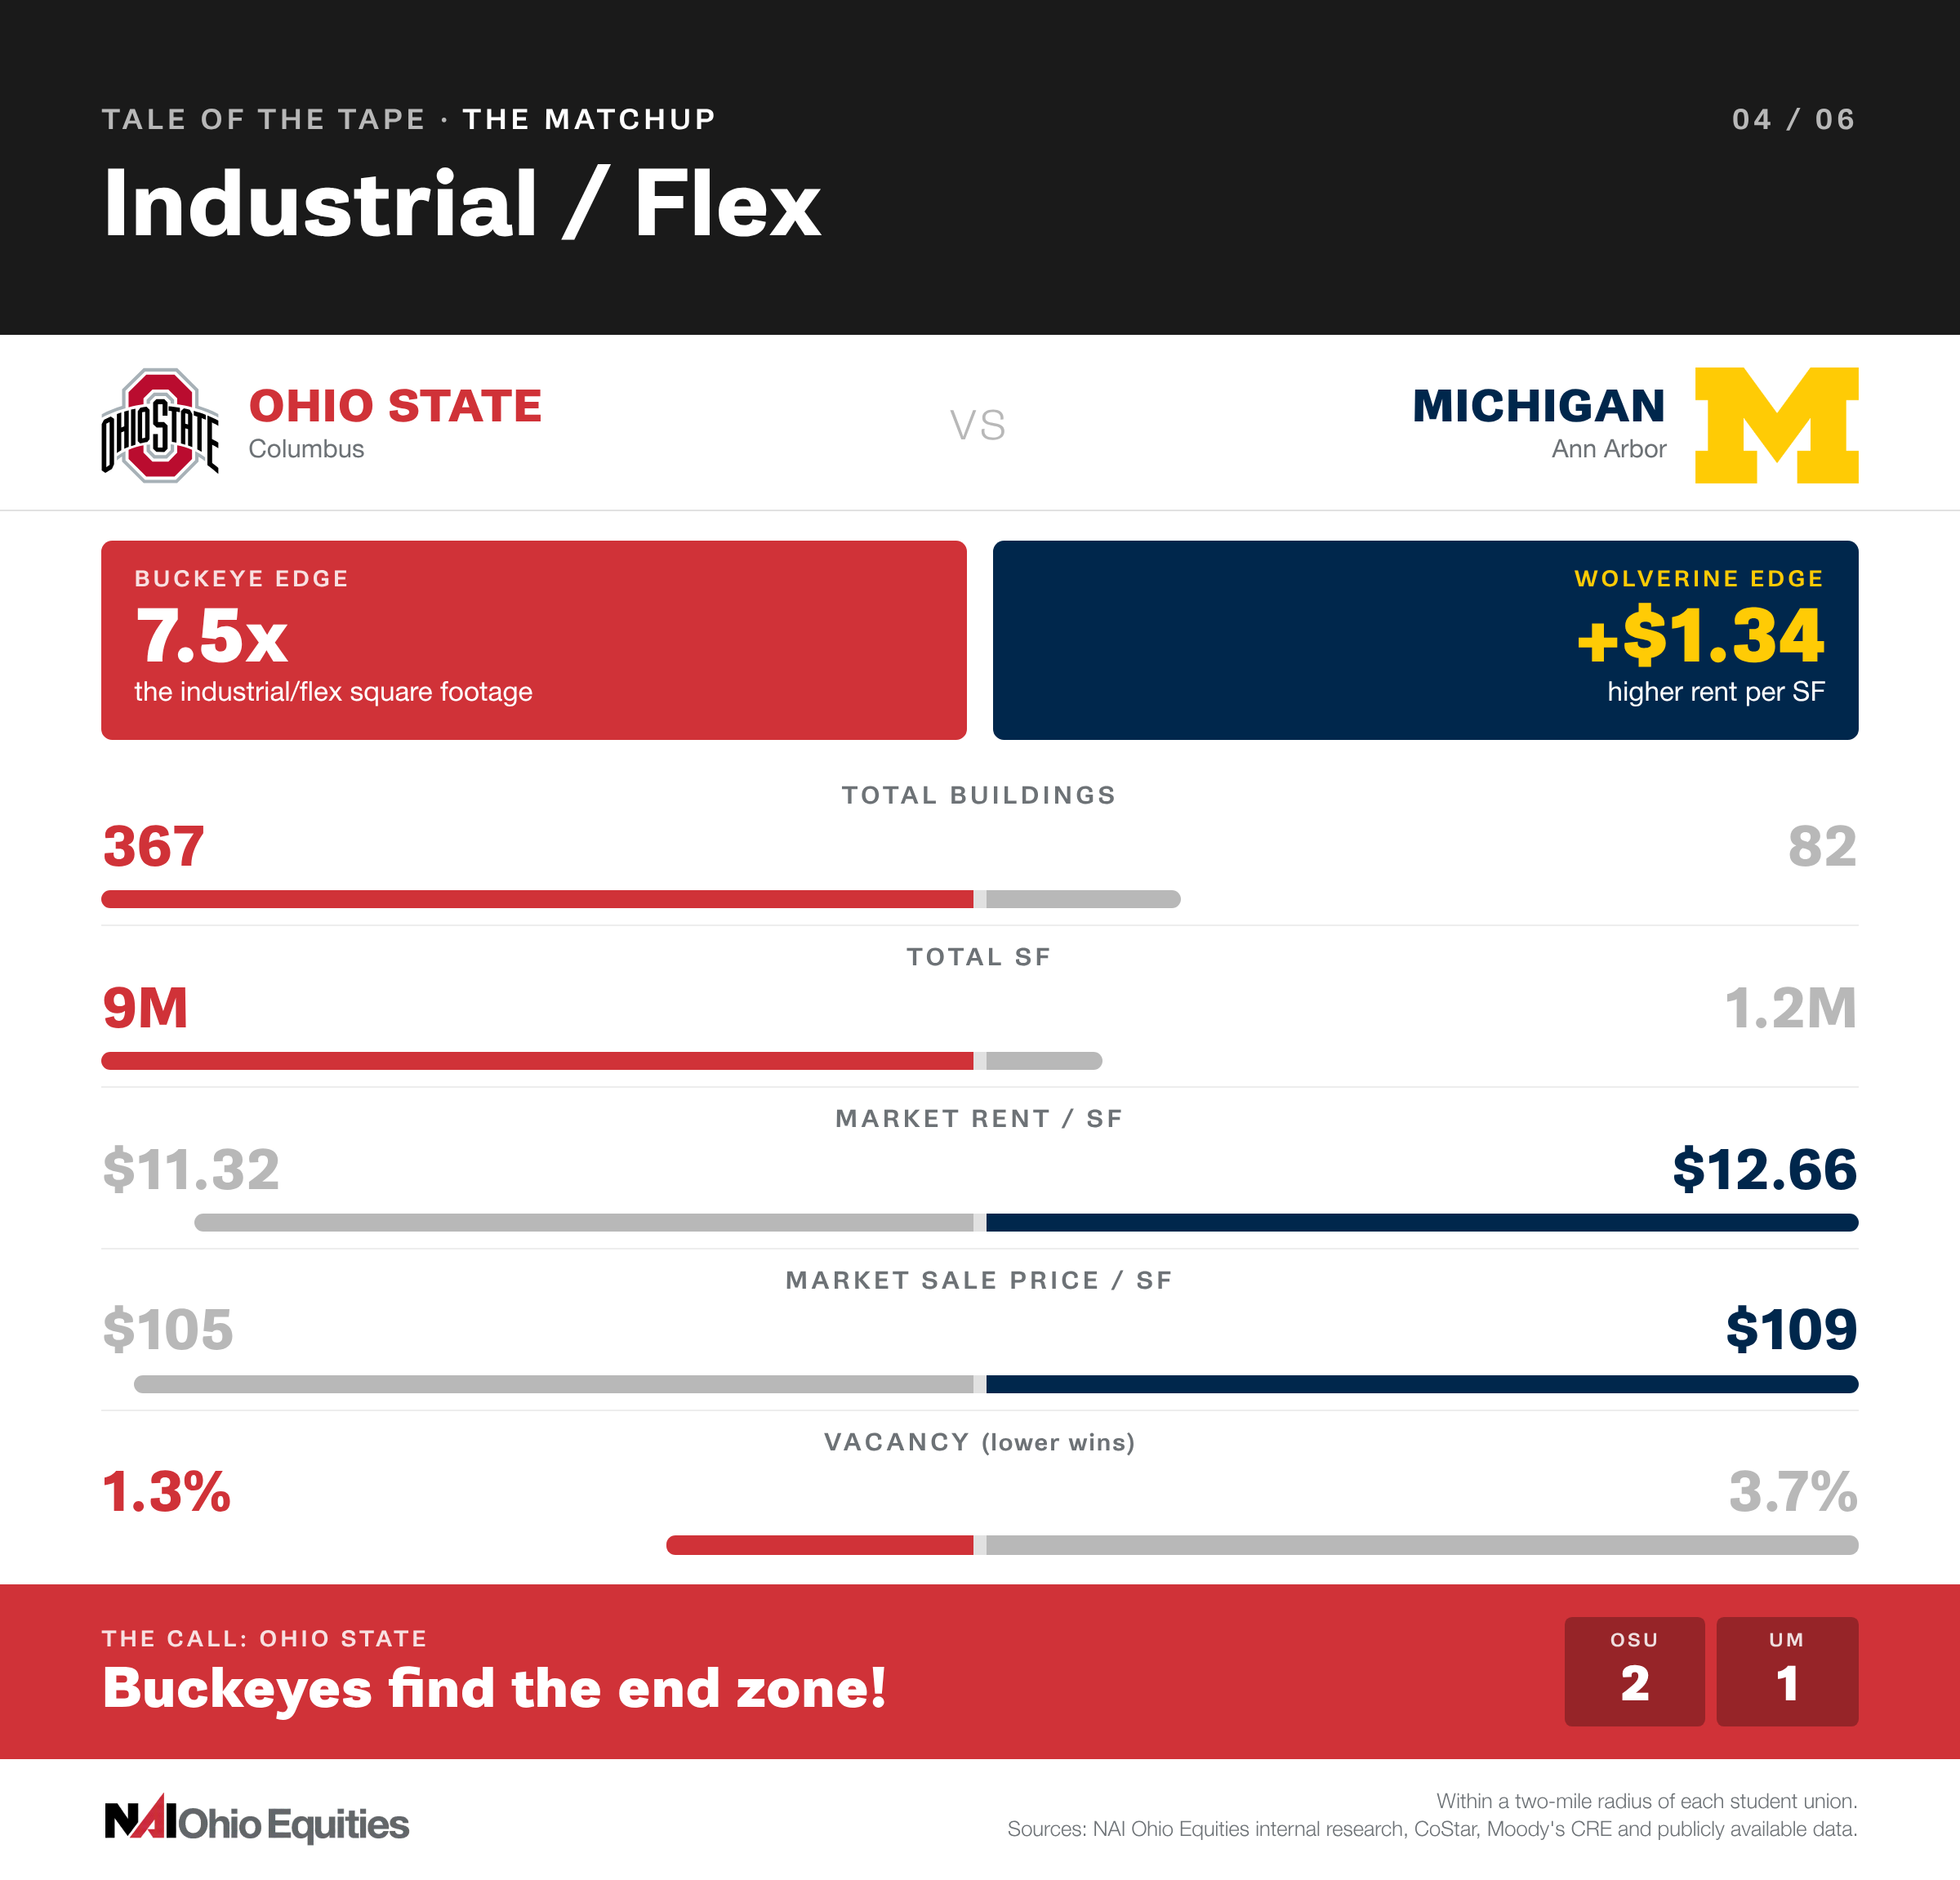
The Call: Buckeyes find the end zone! More buildings, more than seven times the square footage and lower vacancy. No instant replay needed. Ohio State takes this one in convincing fashion.
__________________________________
The Matchup: Retail
The Analysis: High Street is bringing its A-game! Ohio State takes the lead with 651 retail buildings and 4.7 million square feet, compared to Michigan's 449 buildings and 2.9 million square feet. The Buckeyes also have the edge in occupancy, with just 1.6% vacancy compared to Michigan's 2.5%. But the Wolverines aren't going down without a fight, commanding higher rents and boasting an estimated 400 to 450 restaurants compared to Ohio State's 350 to 450. And as for which campus has the better bars? Both sides have plenty of options, but we're staying out of that argument.
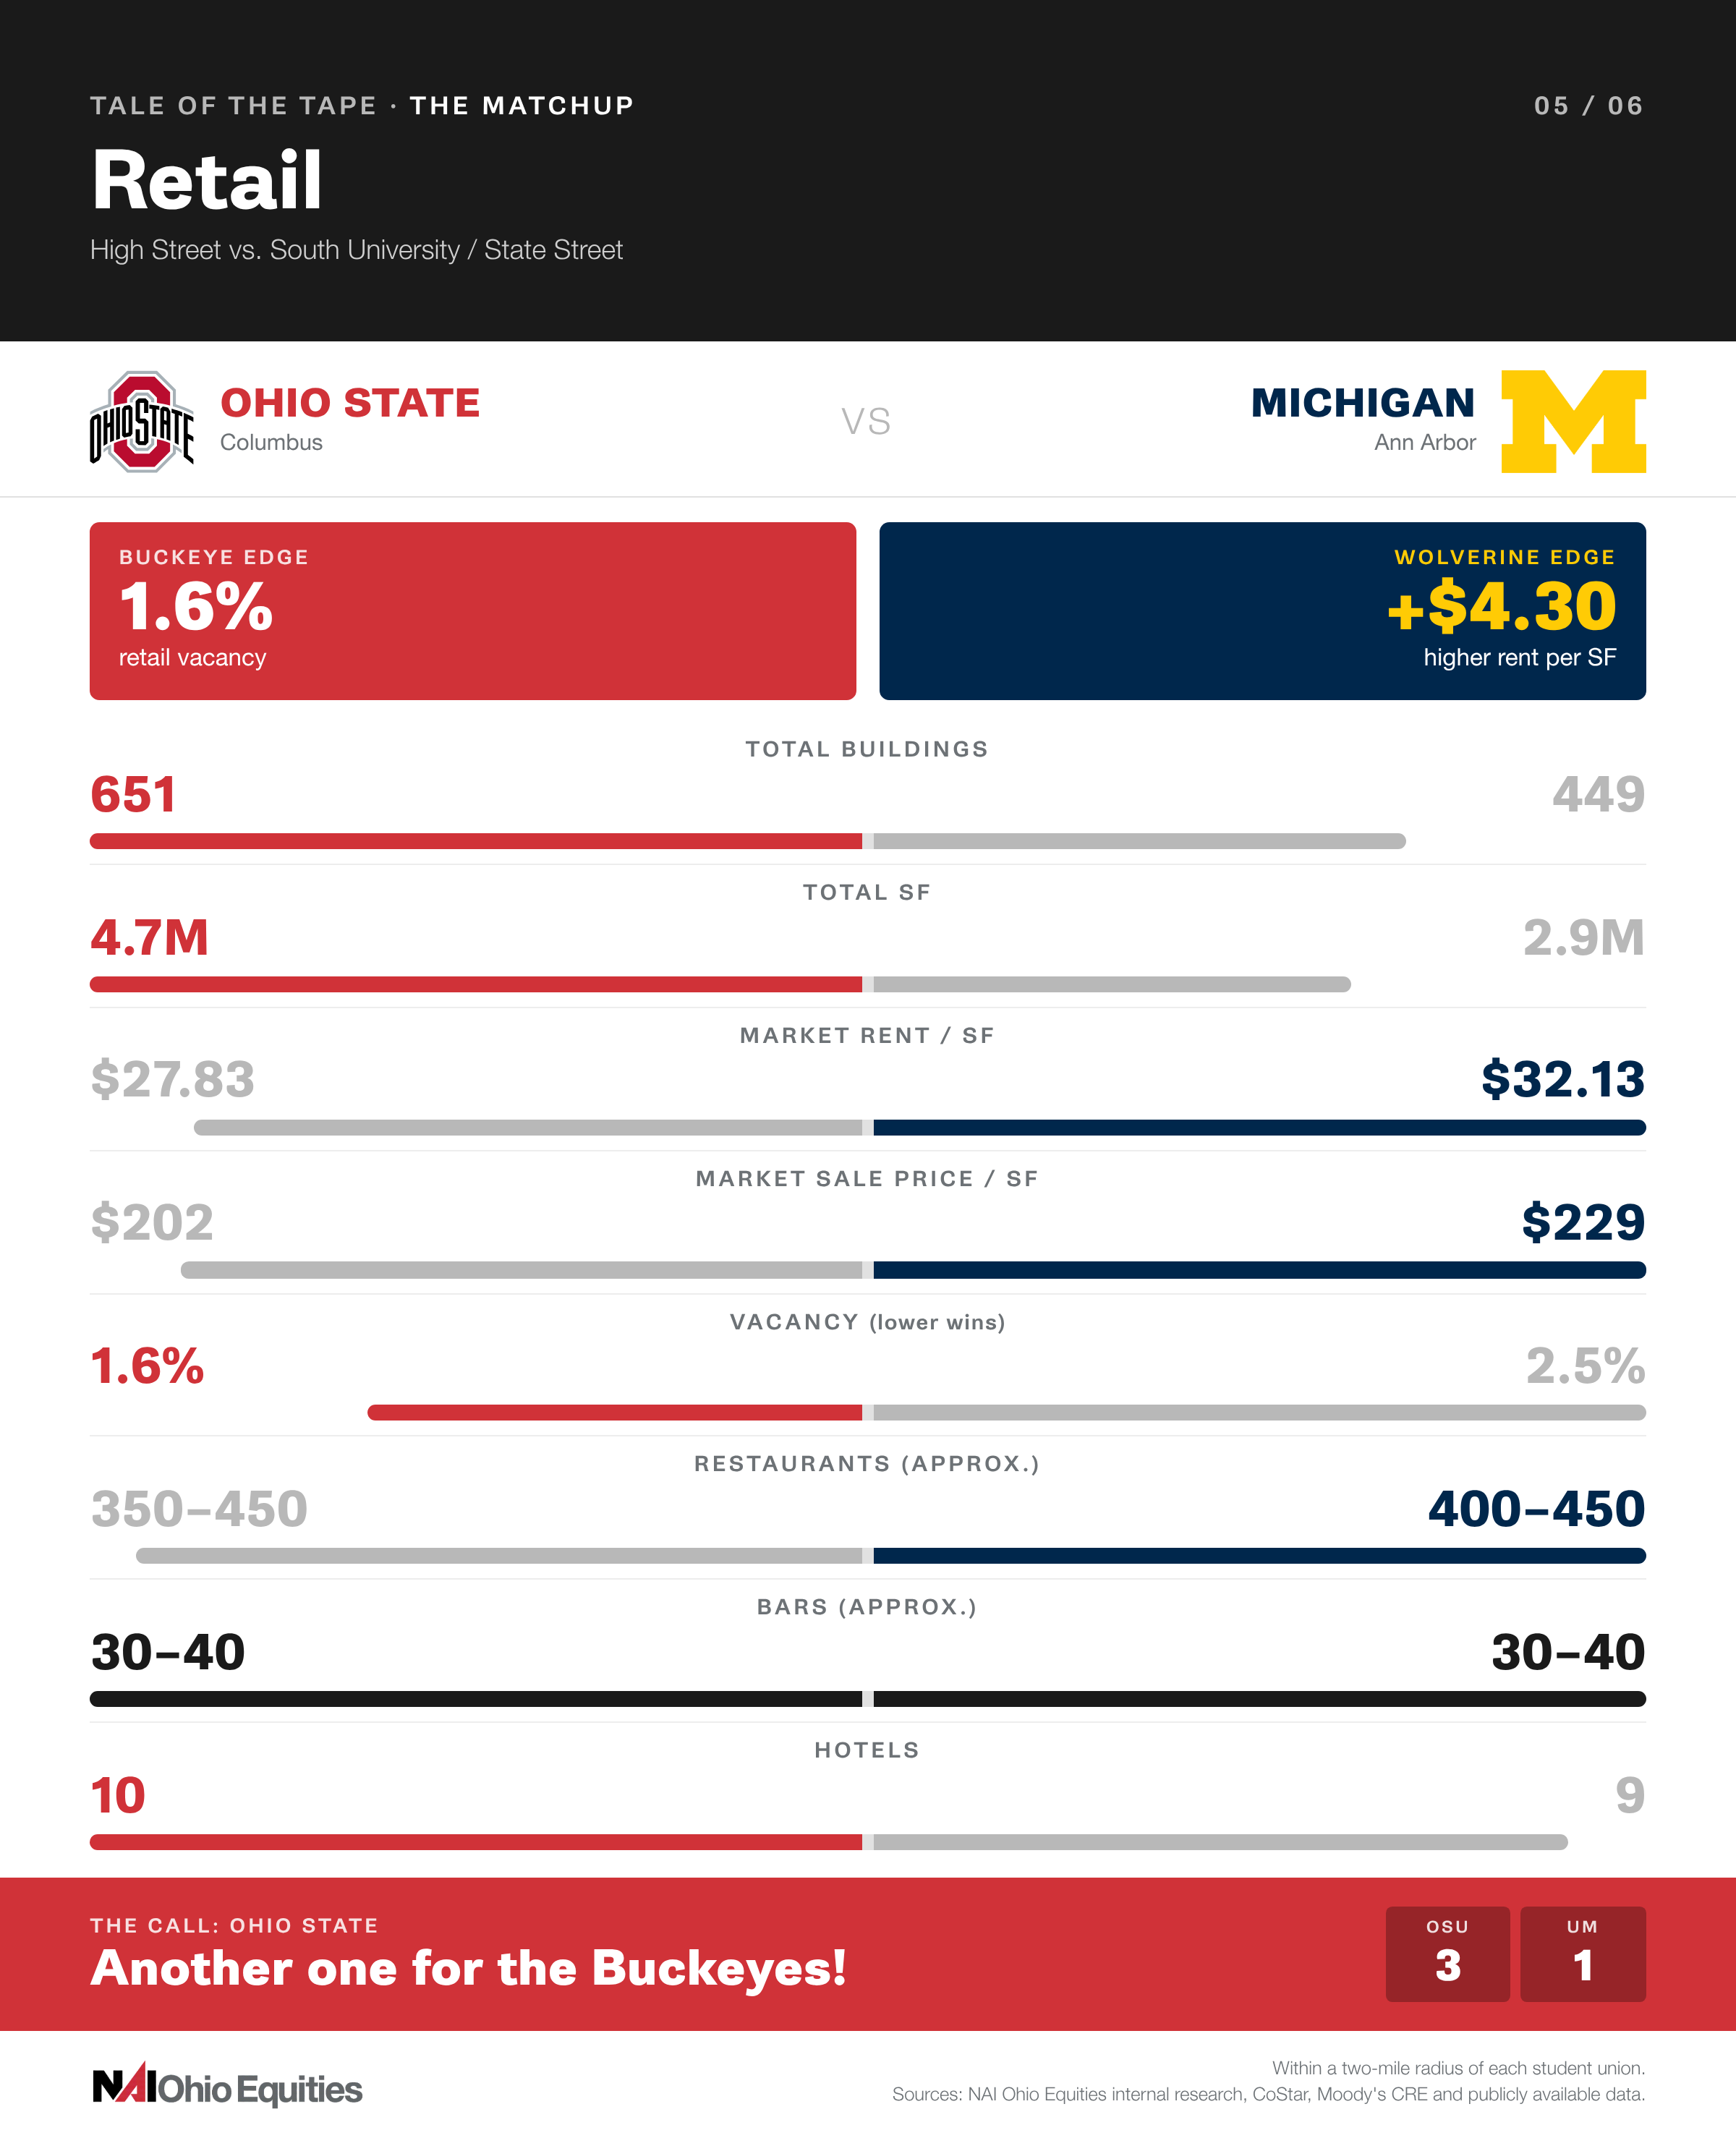
The Call: Another one for the Buckeyes! Ohio State takes the retail matchup on inventory and occupancy, but Michigan keeps things interesting with higher rents and a strong restaurant lineup. The nightlife debate, however, remains officially unresolved.
__________________________________
The Matchup: Off-Campus Student Housing
The Analysis: When it comes to off-campus living, both universities have plenty of talent on the roster, but they're running very different plays.
Michigan brings the premium pricing, with higher rents across every bedroom category and an average sale price of $188,104 per unit compared to Ohio State's $143,587.
But the Buckeyes have a strong defensive showing when it comes to vacancy. Ohio State's rate sits at 7.4% compared to Michigan's 13.5%, a difference of 6.1 percentage points.
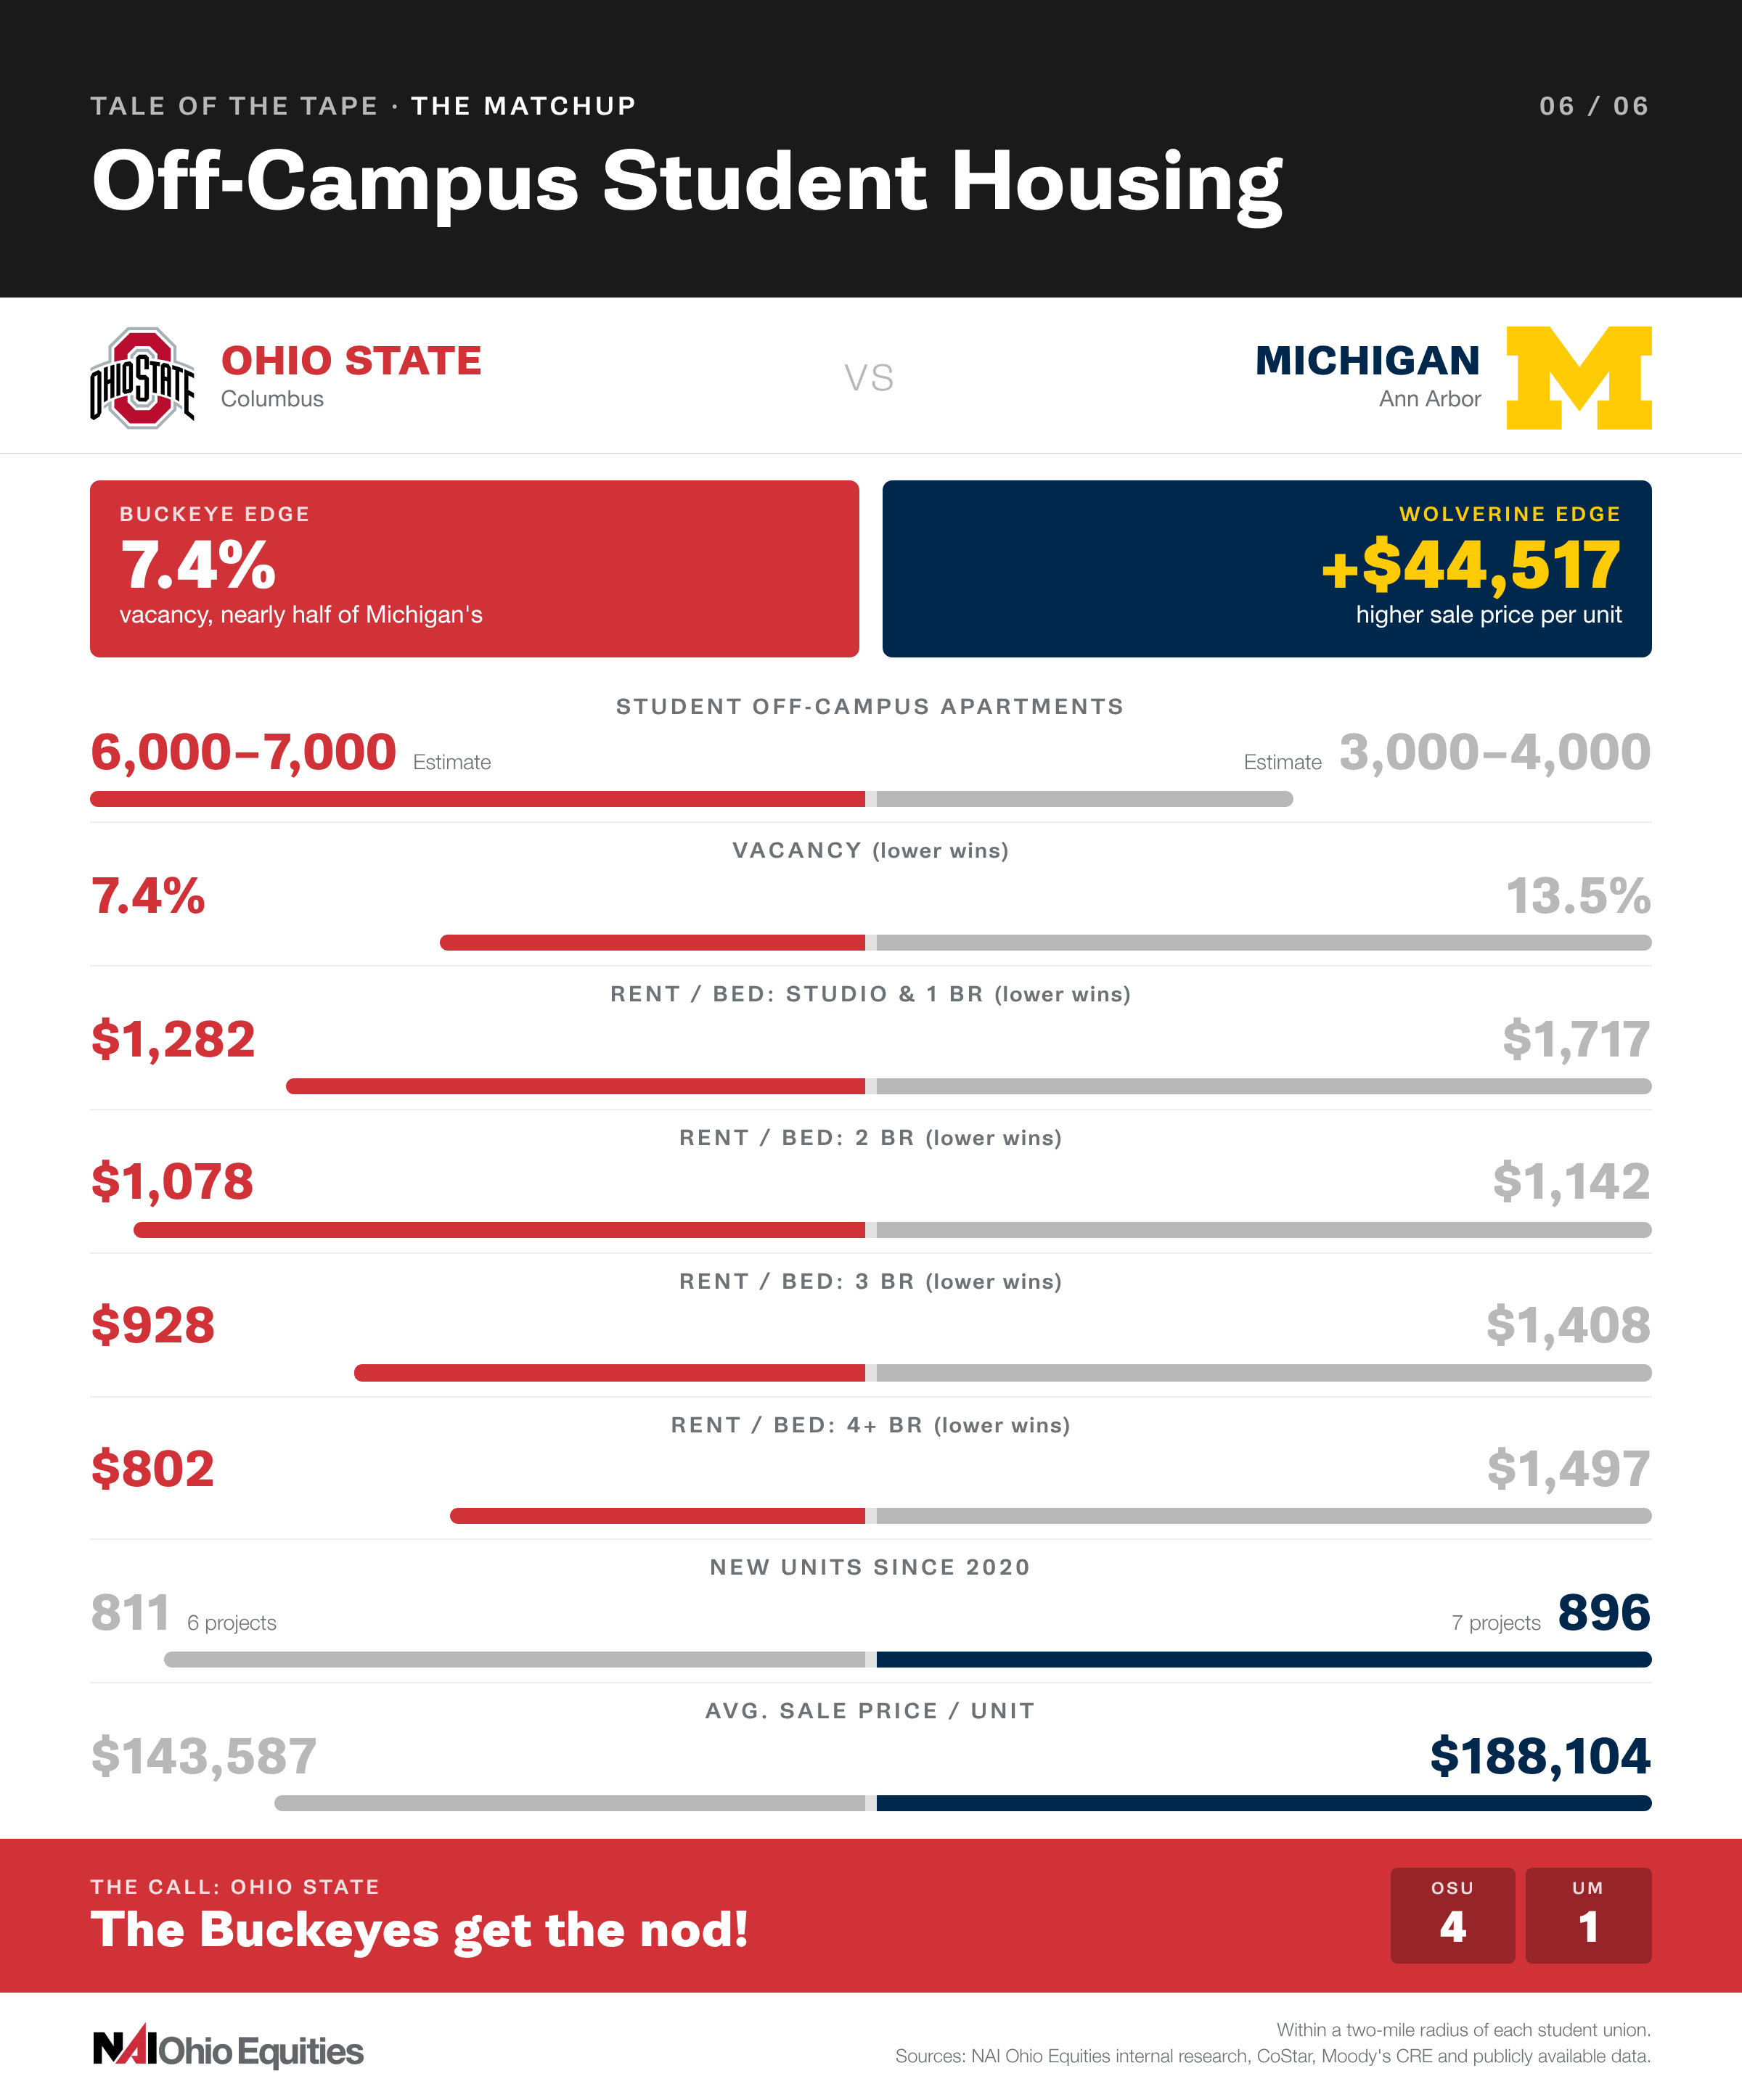
The Call: Michigan leads in rental rates and sale prices, but Ohio State wins where it counts – with occupancy and estimated apartment inventory. With a vacancy rate nearly half that of Michigan's, the Buckeyes get the nod in this matchup.
__________________________________
The Final Score
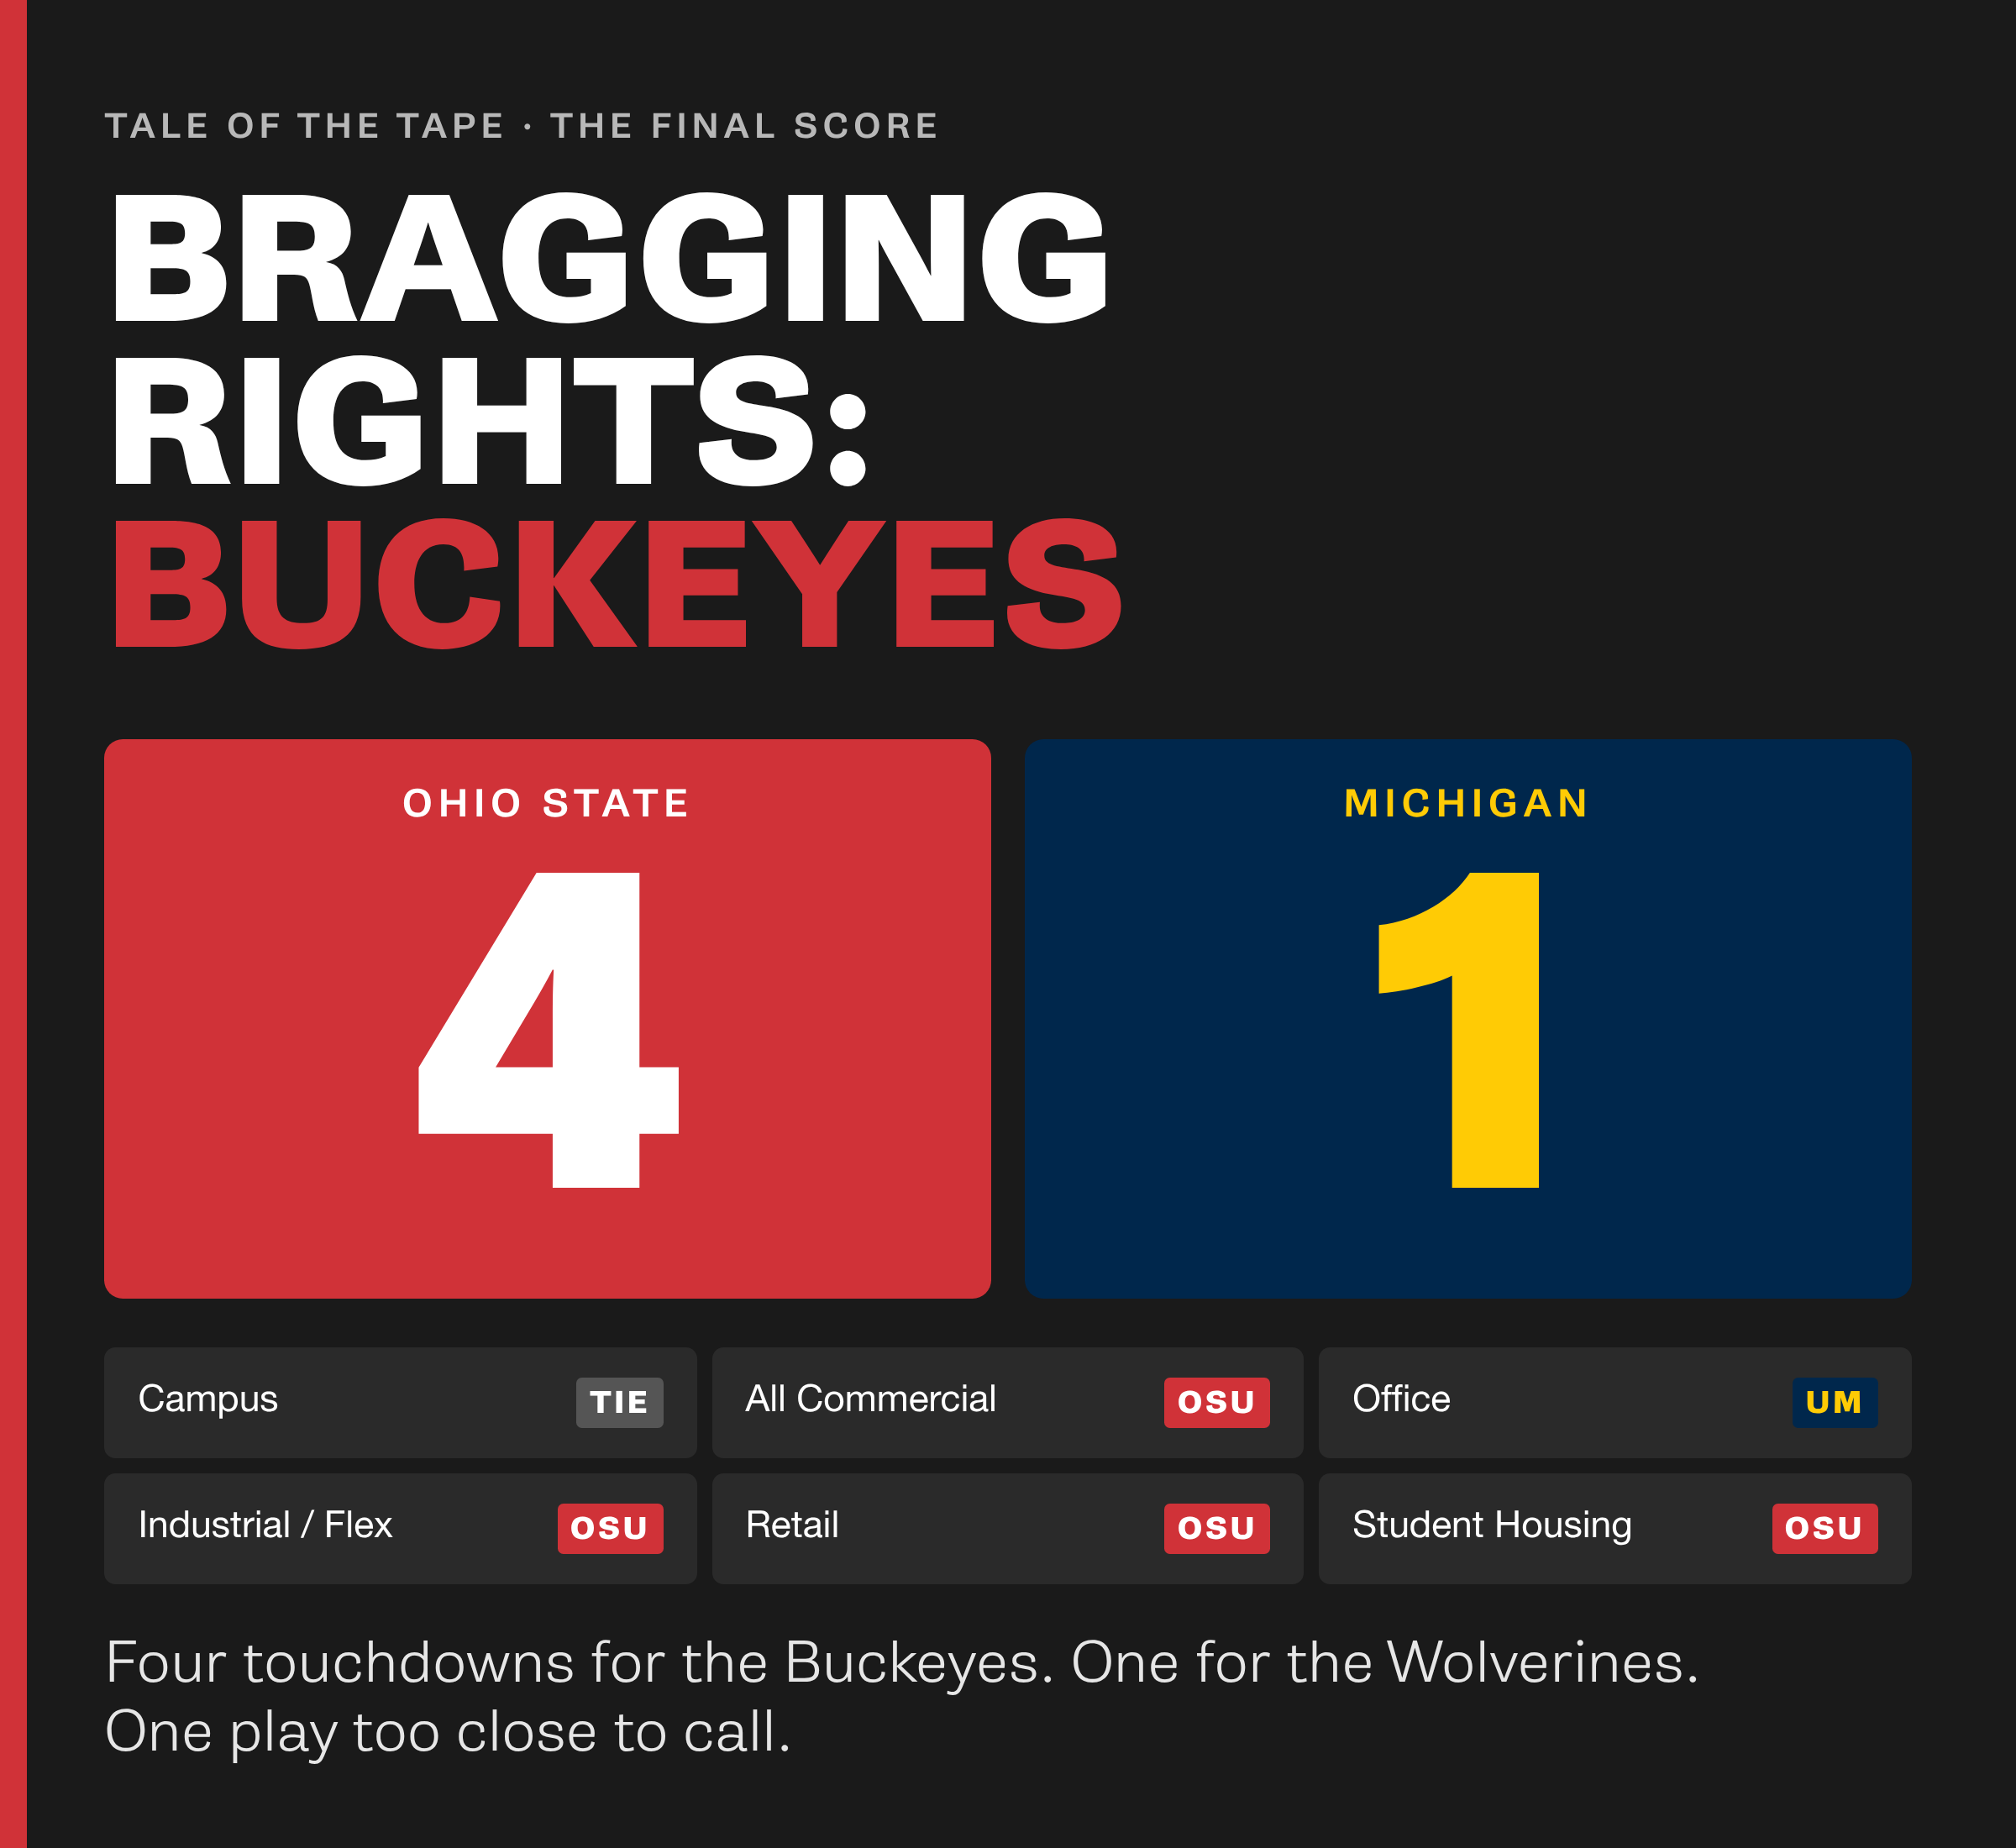
Four touchdowns for the Buckeyes. One for the Wolverines. And one play too close to call.
Michigan gets on the board with a score in office, but Ohio State dominates the field. From industrial and retail to student housing, the Buckeyes have earned the bragging rights in this inaugural Tale of the Tape.
As for the showdown on the gridiron? Let’s just say we’ve got a hunch.
Sources: NAI Ohio Equities internal research, CoStar, Moody's CRE and publicly available data.
Recent Articles

Changing How We Measure the Market to Better Tell Its Story

What Bayer’s $2.2 Billion Investment Could Mean for Central Ohio’s Industrial Real Estate Market

Issue 28: Community Protection or Cautionary Tale?